The art of fruit drying has been practiced for centuries, yet modern food science continues to refine our understanding of moisture control through drying curves. These curves serve as the backbone of industrial dehydration processes, dictating everything from energy efficiency to final product quality. Mastering the relationship between time, temperature, and moisture content separates mediocre dried fruits from premium shelf-stable products that retain vibrant colors, concentrated flavors, and ideal textures.
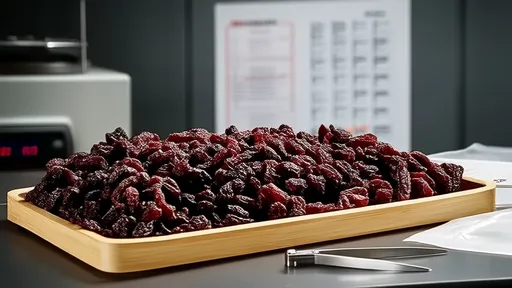
At the heart of every successful drying operation lies the fundamental principle of moisture migration. Fresh fruits typically contain 80-95% water, most of which must be removed to achieve shelf stability. The drying curve graphically represents this journey from high moisture to safe storage levels, typically below 20% for most fruits. What makes these curves particularly fascinating is their nonlinear nature - the rate of moisture loss changes dramatically throughout different phases of dehydration. Initial stages show rapid water evaporation from surface layers, while later phases involve the more challenging removal of bound water from cellular structures.
Understanding the distinct phases of drying curves proves essential for optimizing both quality and efficiency. The constant rate period sees free surface moisture evaporating quickly, with temperature being the primary controlling factor. As the surface dries, the process transitions into the falling rate period where internal moisture must travel to the surface before evaporating. This critical transition point often determines whether a product will case-harden - forming a dry shell that traps interior moisture - or dry evenly throughout. Advanced operations now use real-time moisture sensors to detect this transition and automatically adjust drying parameters.
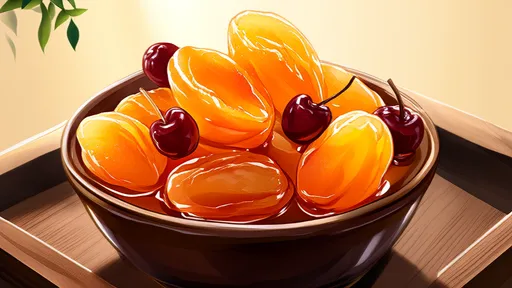
Different fruits present unique drying challenges reflected in their characteristic curves. Berries with waxy skins exhibit prolonged constant rate periods as moisture struggles to escape through the cuticle layer. Stone fruits like apricots and peaches show dramatic falling rate periods due to their dense flesh structure. Tropical fruits often contain sugars that crystallize at certain moisture levels, creating distinctive plateaus in their drying curves. These variations necessitate customized drying programs rather than one-size-fits-all approaches.
The relationship between temperature and drying curves involves careful balancing. While higher temperatures accelerate moisture removal, they can degrade heat-sensitive nutrients, cause excessive shrinkage, or lead to surface hardening. Modern approaches combine temperature modulation with humidity control, creating step-down drying profiles that follow the ideal curve for each product. Some innovative systems even incorporate rest periods between active drying phases, allowing moisture to redistribute naturally within the fruit - a technique borrowed from traditional drying methods but now optimized with precision controls.
Water activity (aw) has become an increasingly important metric in dried fruit production, and drying curves now often incorporate aw measurements alongside traditional moisture content data. This shift recognizes that microbial safety and product stability depend more on water availability than total water content. Advanced operations create three-dimensional drying models that plot moisture content, water activity, and time simultaneously, enabling processors to identify the exact point where products achieve microbial stability while maintaining optimal sensory qualities.
Energy efficiency has driven significant innovations in drying curve optimization. By precisely mapping how moisture removal rates change throughout the process, engineers can design systems that reduce heat input during natural slowing periods. Some facilities employ waste heat recovery during high-evaporation phases, while others use hybrid systems that switch between conventional and microwave-assisted drying at predetermined curve inflection points. These approaches can reduce energy consumption by 30-40% compared to traditional constant-temperature drying.
Quality control laboratories now use drying curve analysis to troubleshoot production issues. Abnormal curve shapes can indicate problems like uneven air flow, improper loading densities, or raw material variations. For instance, a curve that falls too rapidly might suggest excessive surface damage from pretreatment, while a curve that plateaus unexpectedly could reveal sugar crystallization issues. This diagnostic approach has become particularly valuable as processors work with increasingly diverse fruit varieties, each with unique drying characteristics.
Emerging technologies are pushing drying curve applications into new frontiers. Computer vision systems can now track surface moisture in real-time, creating dynamic drying curves for individual pieces rather than batch averages. AI algorithms analyze historical curve data to predict optimal drying parameters for new varieties or unusual growing conditions. Some research facilities are even developing molecular-level drying models that account for water binding at the cellular level, potentially revolutionizing how we understand moisture movement in plant tissues.
The future of fruit drying will likely see greater integration of these advanced technologies with traditional knowledge. As consumers demand higher quality dried fruits with minimal additives, precise moisture control through optimized drying curves becomes increasingly vital. The challenge lies in balancing high-tech solutions with the artisanal qualities that make dried fruits appealing - ensuring that technological precision enhances rather than replaces the natural variations that give each fruit its character. In this evolving landscape, the humble drying curve remains an indispensable tool for creating products that are simultaneously safe, delicious, and efficient to produce.

By /Jul 14, 2025
By /Jul 14, 2025
By /Jul 14, 2025
By /Jul 14, 2025

By /Jul 14, 2025
By /Jul 14, 2025
By /Jul 14, 2025
By /Jul 14, 2025
By /Jul 14, 2025
By /Jul 14, 2025

By /Jul 14, 2025
By /Jul 14, 2025
By /Jul 14, 2025
By /Jul 14, 2025
By /Jul 14, 2025
By /Jul 14, 2025
By /Jul 14, 2025
By /Jul 14, 2025